Most of my students have English as their second language, so I’m keen on activities which let them practise their language skills. This is one that I did a few days ago.
| I used desmos.com to create the two graphs shown. I wanted graphs which the students would not be able to identify easily, but where they would have the language to describe them. I put the students in pairs, sitting back-to-back, and each had to describe the graph for their partner to draw. Students who tried to use casual language quickly found that their partner had trouble understanding them; they were forced to use terms such as asymptote (vertical or horizontal?), maximum, minimum, intercepts and so on. 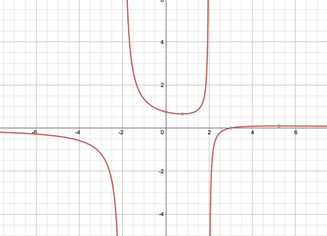 | 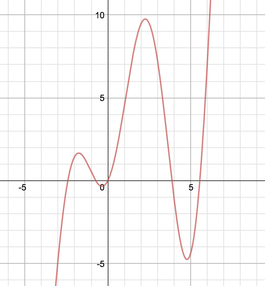 I did this with a year 11 and a year 12 class and it worked well - the students practised the vocabulary and communicated more than they might normally. I asked the students who finished first to try and work out what the equations were*; another possible extension would be for students to create their own graphs. *in case you're wondering the graphs are $y=\frac{x-3}{x^2-4}$ and $y=3x\sin{x}+2x$ |
 RSS Feed
